How to view plant performance and irrigation data
Go to Aeroview, click ‘All farms’ and select your farm. You can view your farm data either in map or table format simply by switching between ‘Map’ or ‘Table’ view.
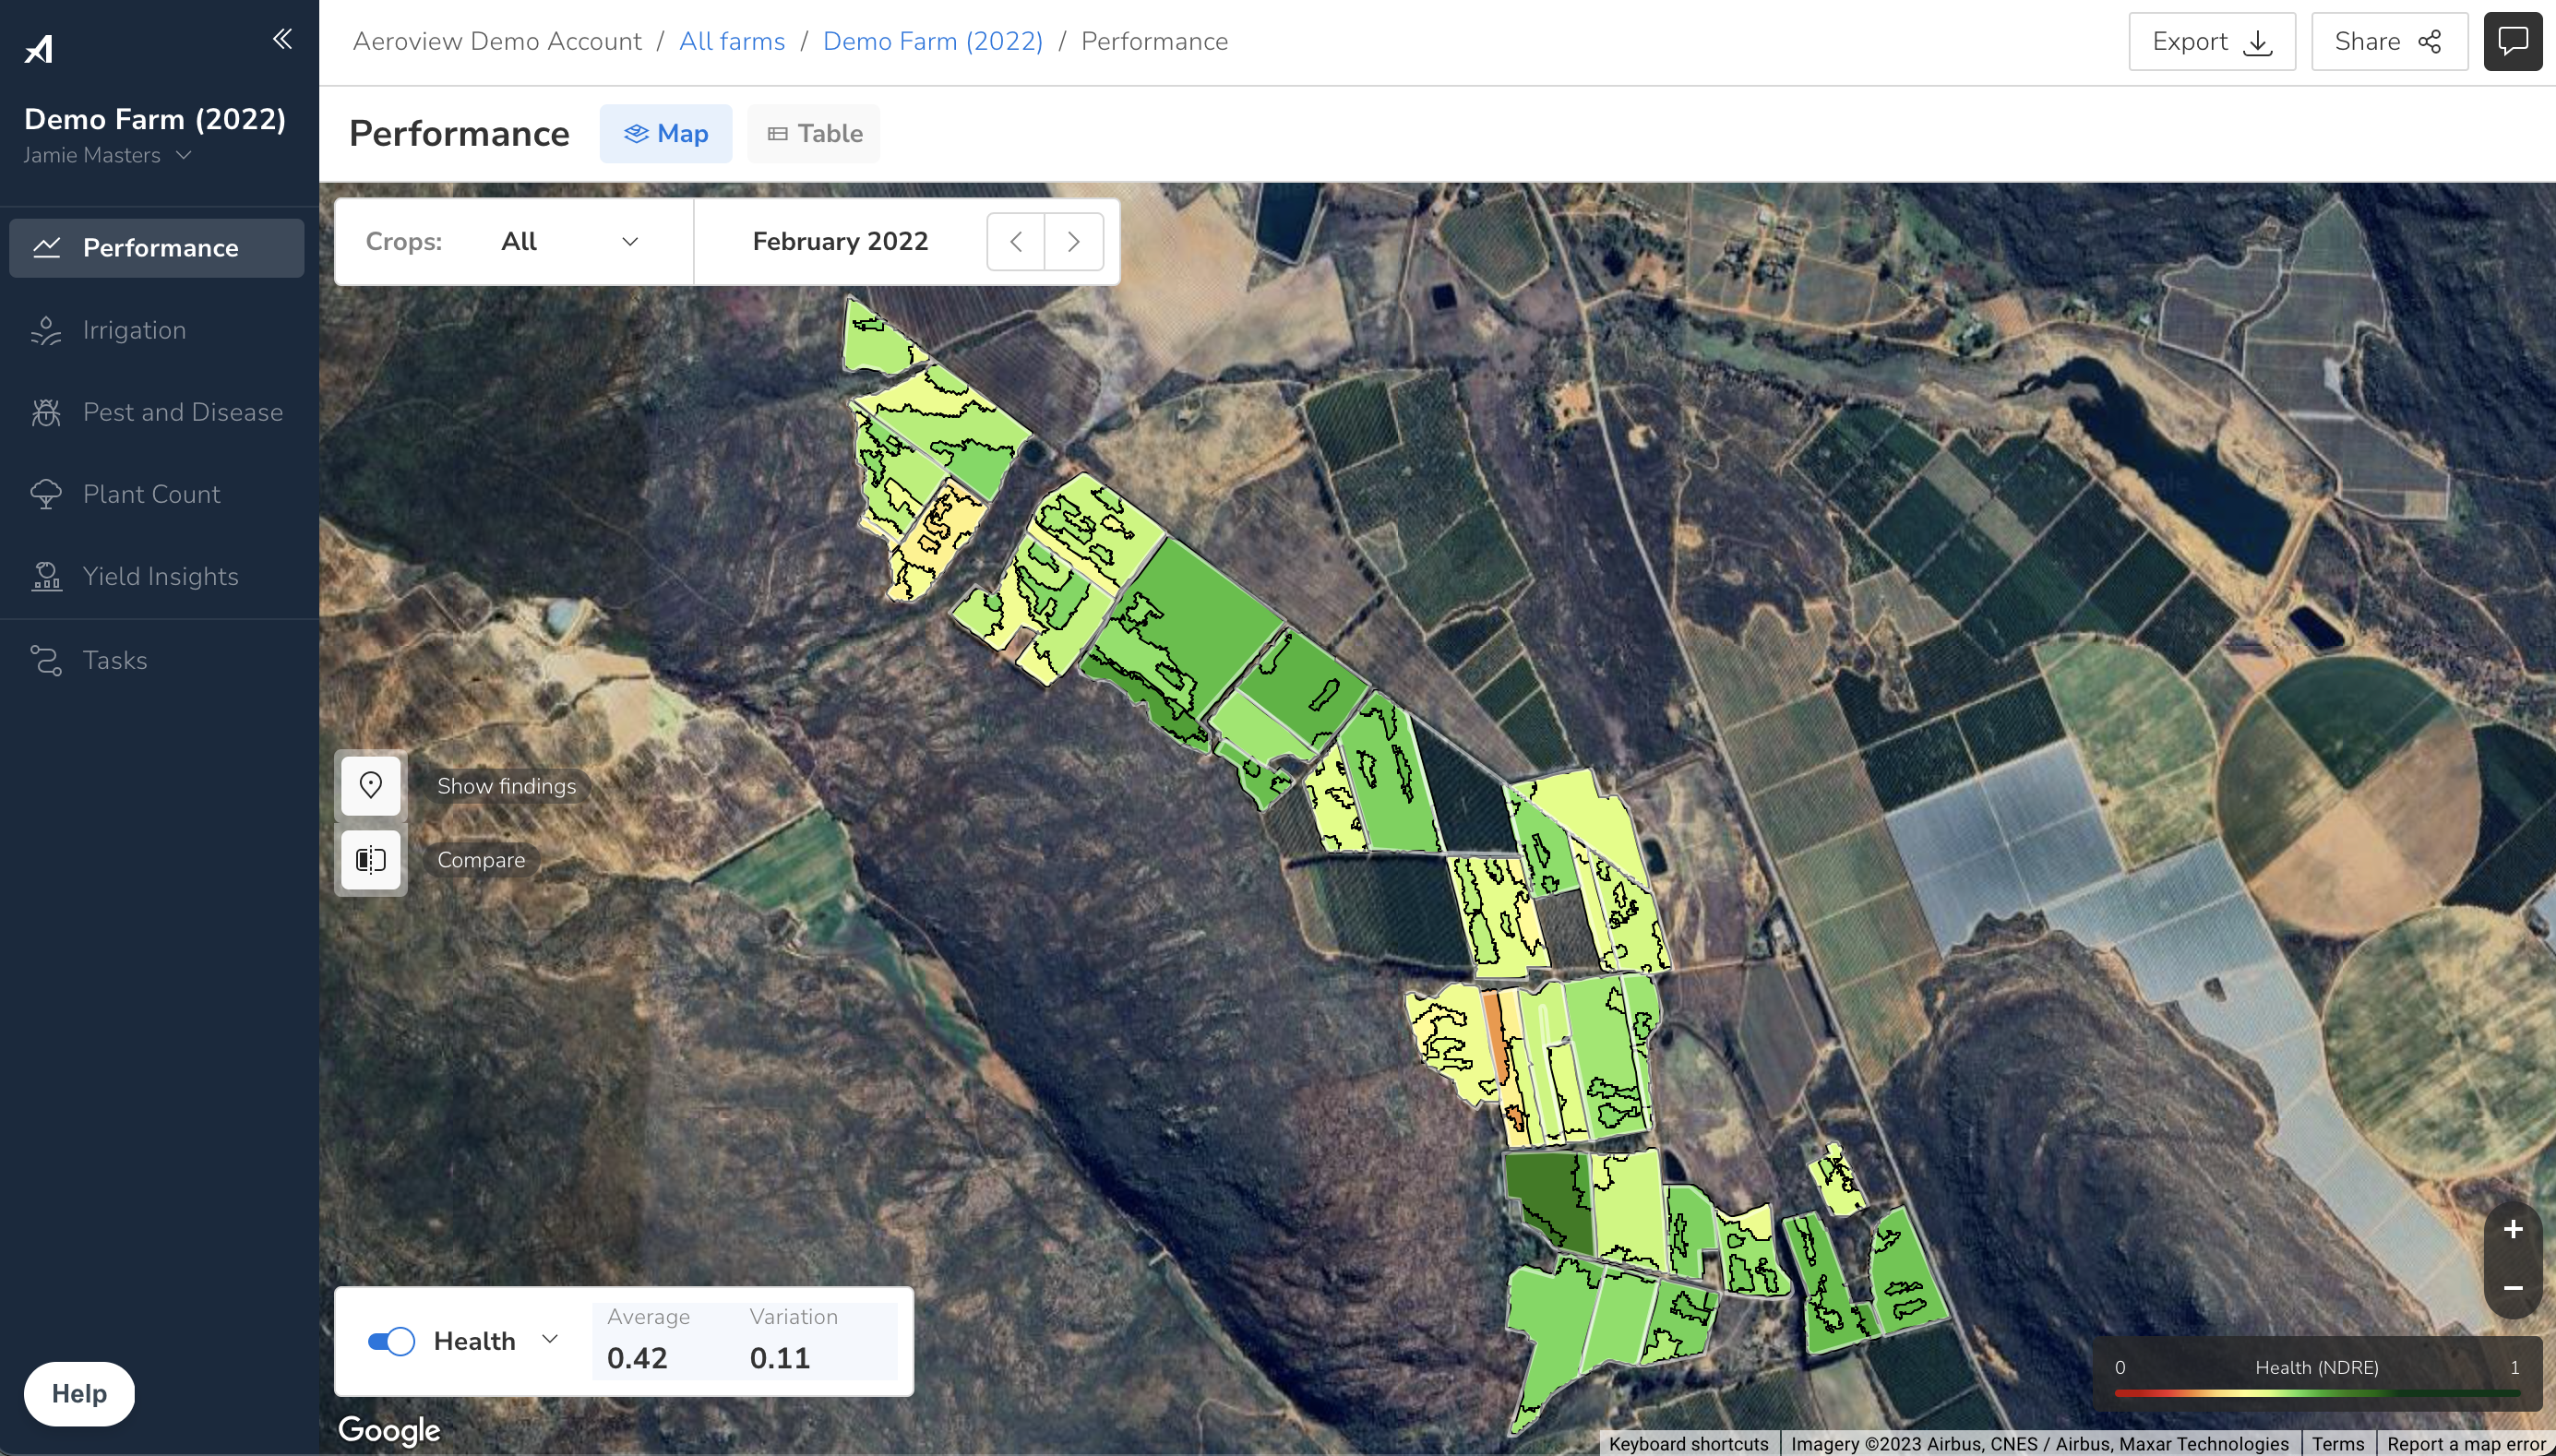
There are many ways that you can filter and analyze performance and irrigation data. Below are some examples:
- Filter by date range: Select the period you would like to view.
- Filter for one or multiple crop types: Click ‘Crops: All’ and selecting relevant crop types from the list. Selecting from this list will filter your view and only display data for blocks with the relevant crop type(s).
- View Tree Insights Map Layers: If this farm has had a drone mapping flight, you can view your key Tree Insights map layers at the bottom of the screen, by clicking ‘Health’. Other layers also available include: ‘Vigor’, ‘Canopy area’ and ‘Volume’.
- View Satellite Data Layers: If this farm has not had a drone mapping flight, you can view free satellite data by selecting between ‘Satellite vigor’ and ‘Satellite moisture’ layers.
- View Aeroview InField App data in map view: If you have collected any findings using our Aeroview InField app, you can view these findings on the map by clicking ‘Show findings’.
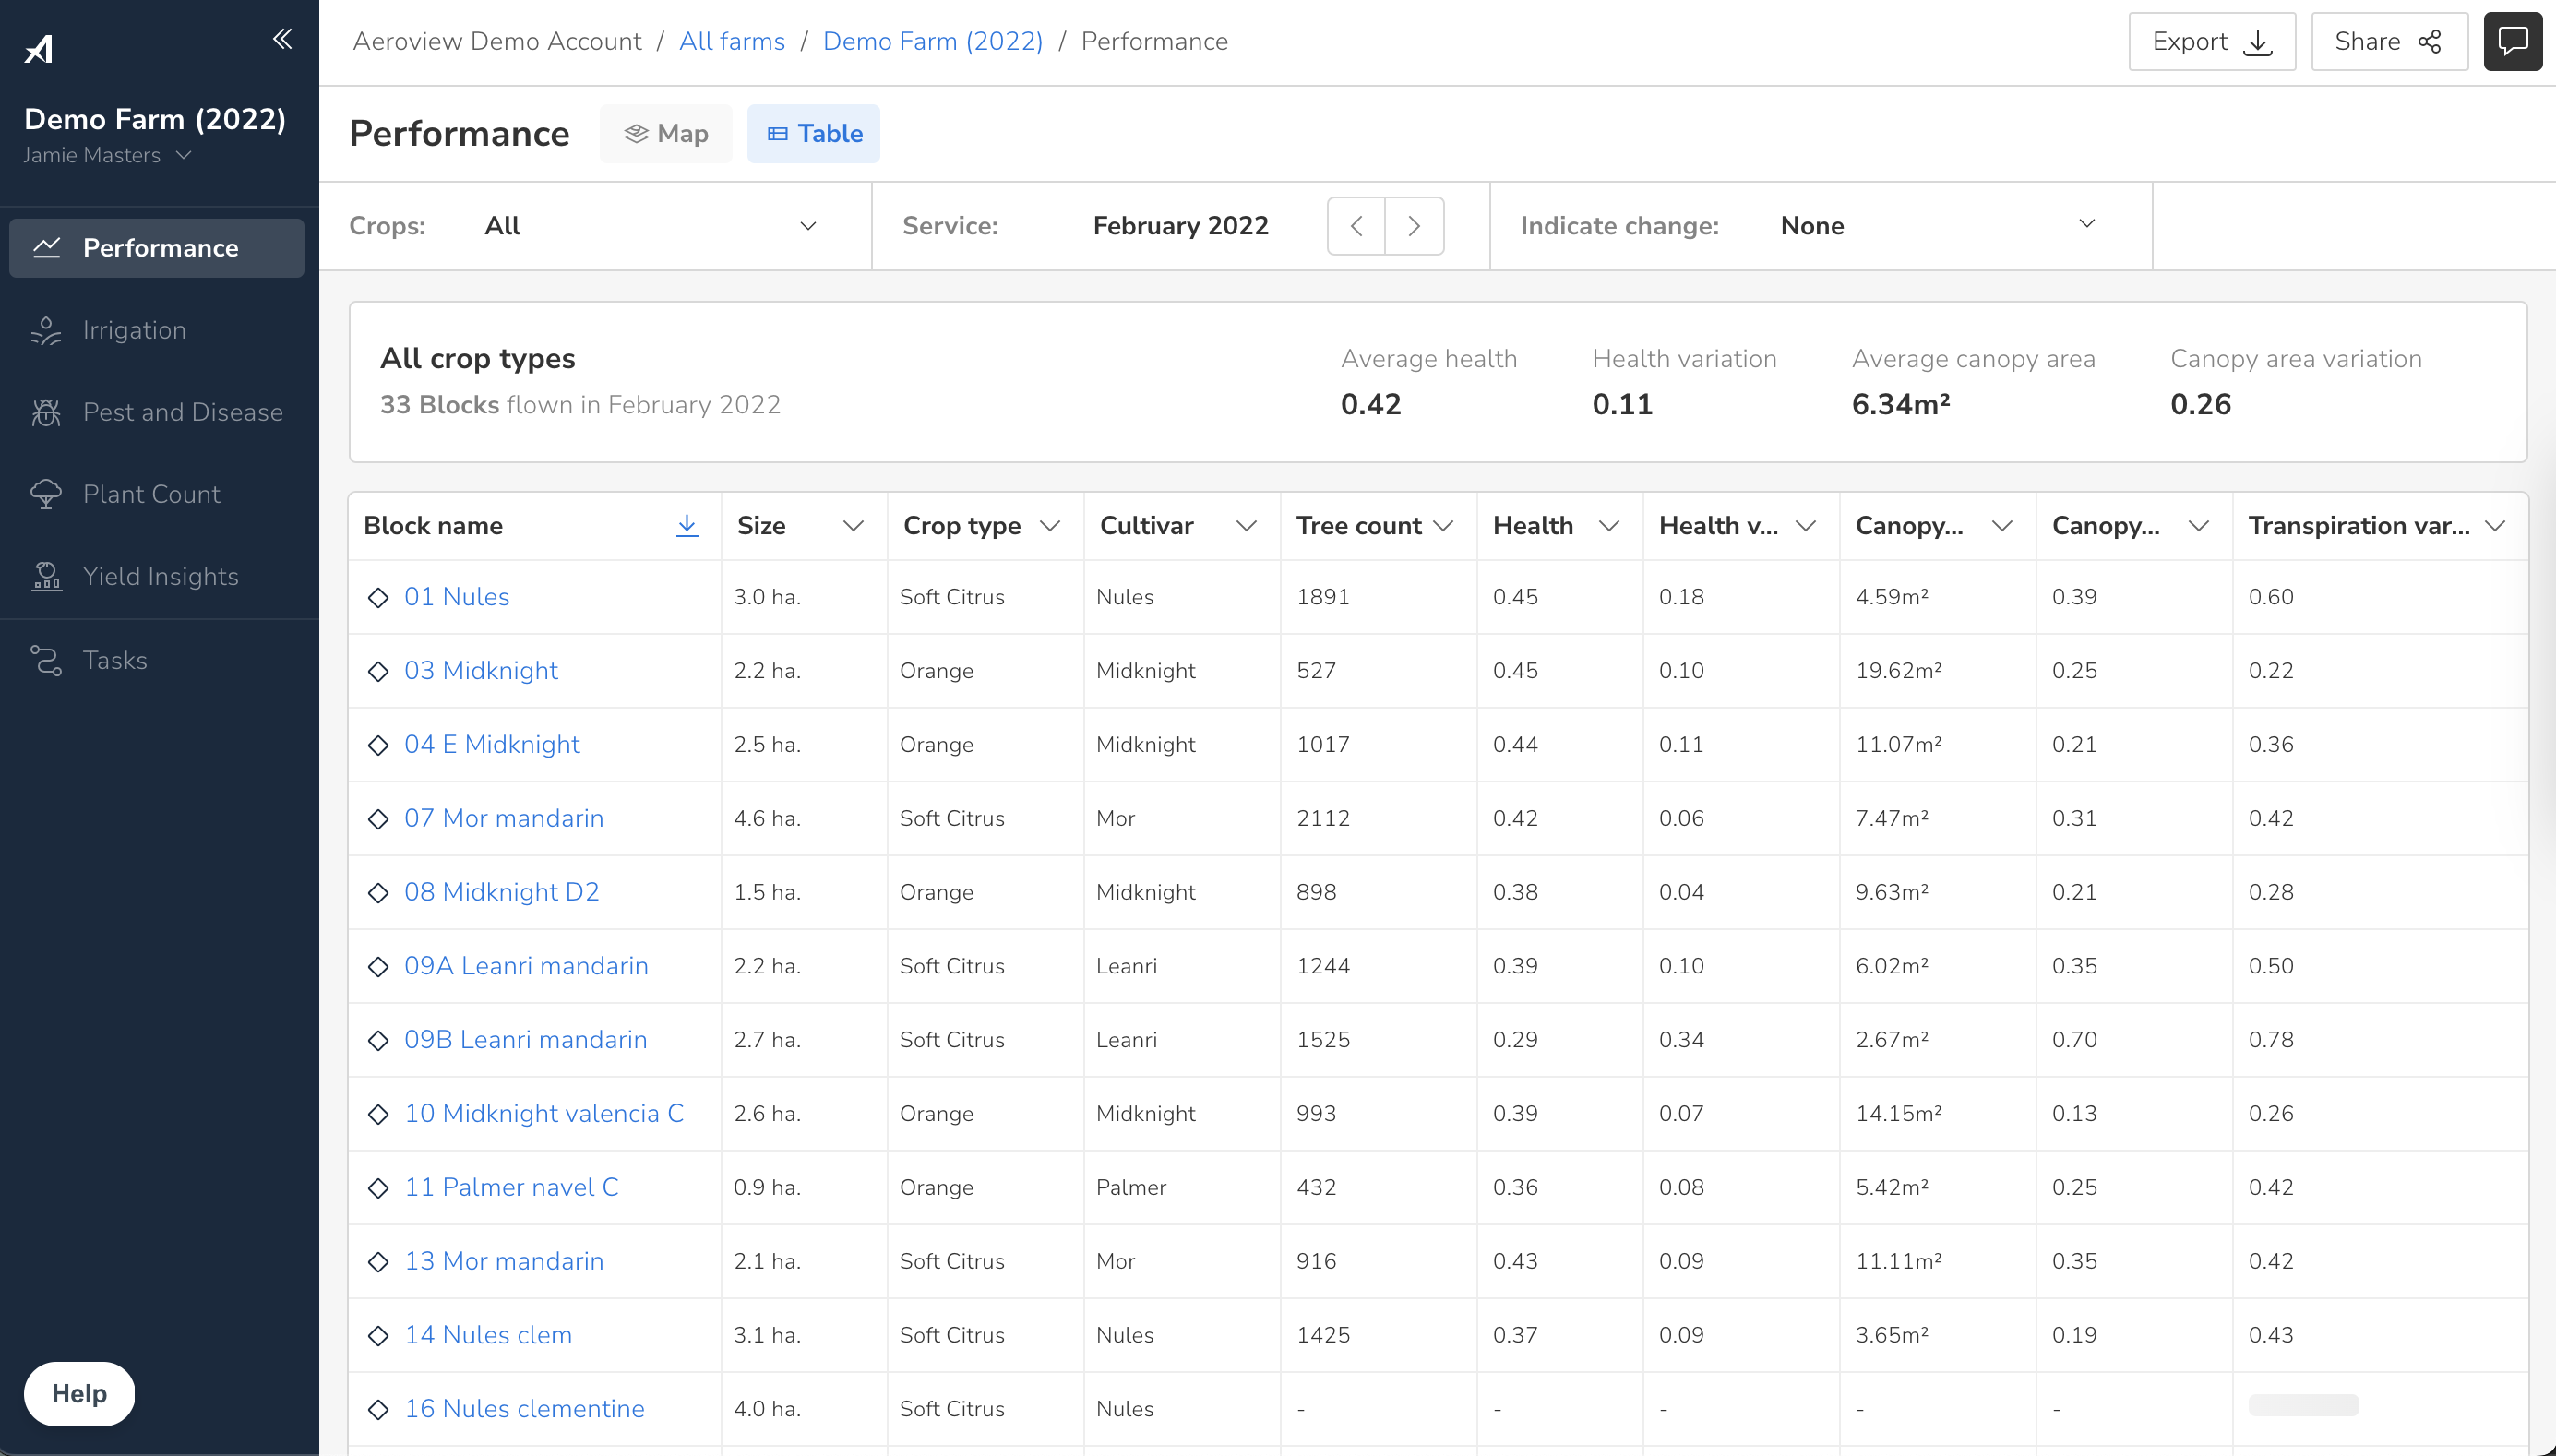
- View tree insights data in table view: On the table view you can see, filter and sort the data for all of your blocks, including Block name, Size, Crop type, Cultivar, Tree count, Health, Health variation, Canopy area and Canopy area variation by clicking on the column header.
- To view a block in more detail: Either select the block on the map (if you are on the map view), or select the block name from the table (if you are on the table view).